Weeks ago I was looking in to a performance issue for our animated spinner component and stumbled across a tool in DevTools I hadn’t used before: The Performance Monitor Panel. In you open Dev Tools > More Tools > Performance Monitor you’ll see some helpful high-level charts and graphs of the realtime performance data of your UI.
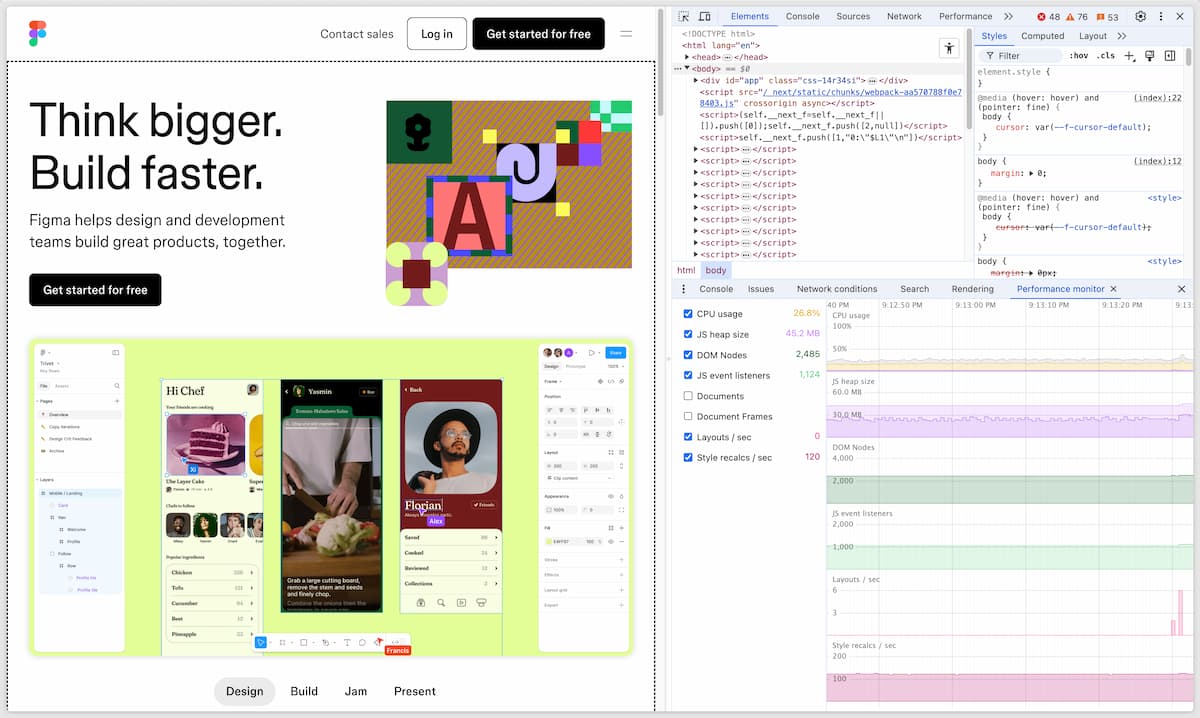
The Performance Monitor collects performance data in realtime and puts it on a graph. It’s handy for detecting performance problems at a high-level. If your CPU, memory, DOM node count, or event listeners only go up while clicking around, you probably have a leak in your code. The part I was most interested in were style recalculations per second and layouts per second. Our spinner component was triggering style recalculations and layout calls at a rate of 120 per second. Yikes! That’s a lot of extra work on the CPU.
Next I turned on Dev Tools > More Tools > Rendering > Show Paint Flashes and I could immediately see the tactile feedback of green boxes thrashing around as the browser repainted the component hundreds of times per second. The green paint boxes confirmed that this UI work was happening on the main thread instead of the compositor thread. The Performance Monitor showed my CPU usage at 5-9% of my Mackbook Pro. Double Yikes.
The Performance Monitor panel pairs nicely with the top-level Performance panel. While the Performance Monitor panel is very high-level, the Performance panel is an in-depth debugging tool where you can inspect a snapshot of your app down to each function and render call.
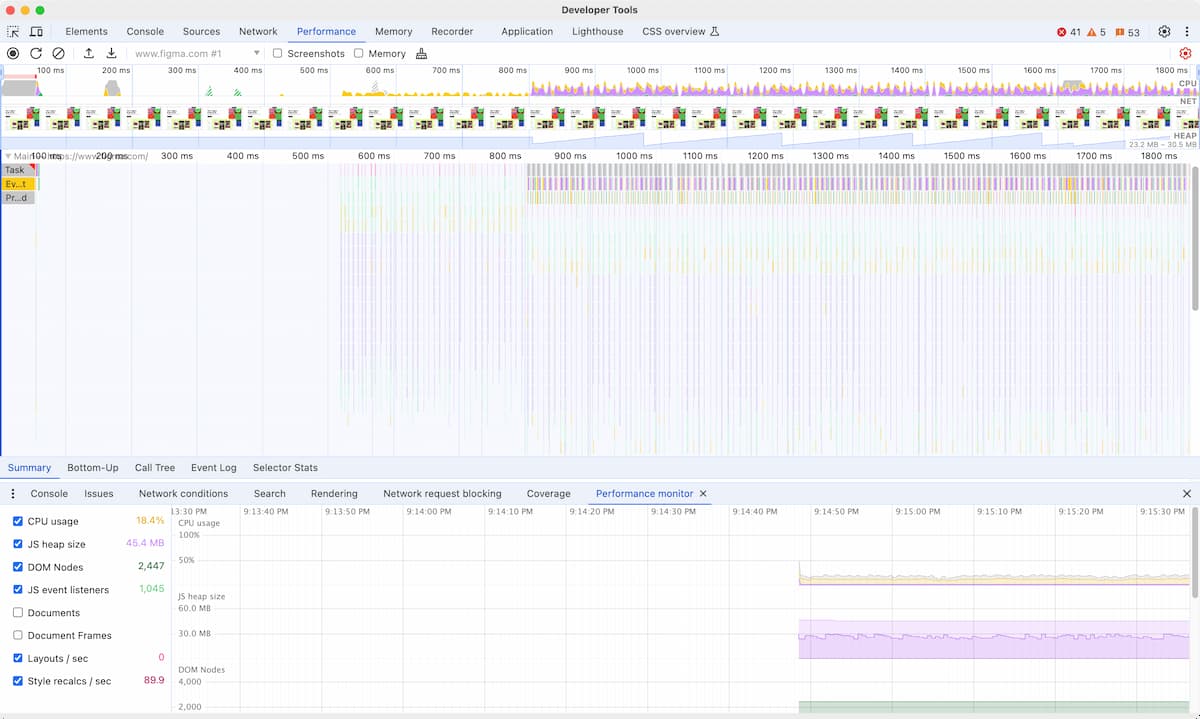
Capturing a snapshot in the Performance panel confirmed what I was now seeing. I could see the “red line of death” of dropped frames where I locked the main thread. The remediation steps were pretty simple but I did need to strip down and recode how our animation worked.
- Avoid properties that trigger paint or layout
- Tamp down layout recalcs with
contain - Use
overflow: hiddeninstead of CSS masks
It took a couple of prototypes to shop around a workable solution. The good news is our animation is off-loaded to the compositor instead of the main thread now. CPU use is now at 0.2% (down from 5-9%) and our recalcs and layouts are down to 0 but the animation still chugs along. Truth be told, a loading spinner is a pretty insignificant component and is only temporary, but reducing CPU usage by 10% here makes room for other JavaScript activities… like… y’know… fetching and parsing data.